The Brain Tumor Reporting and Data System (BT-RADS)
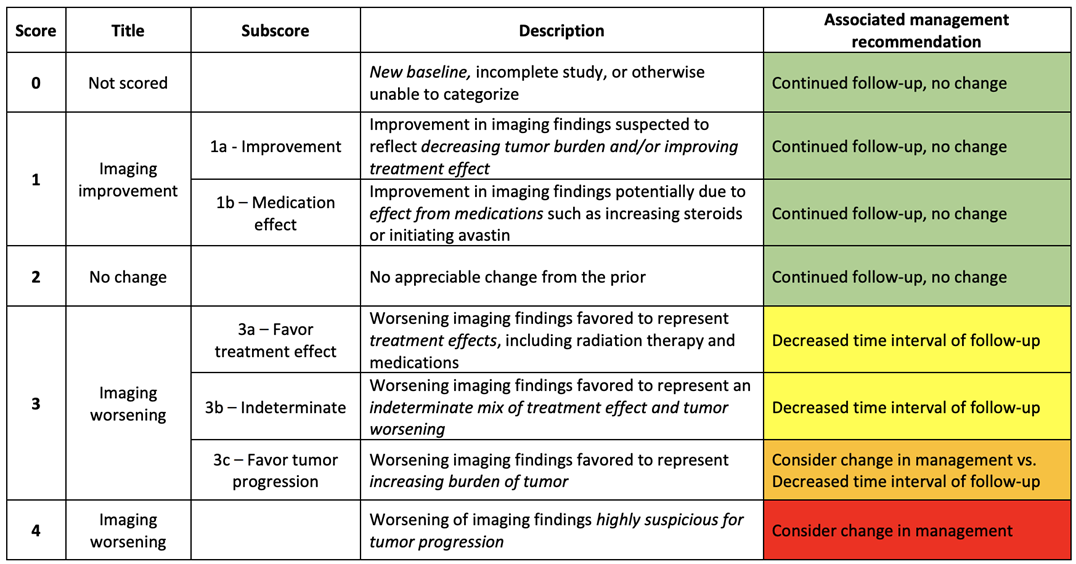
Structured reporting is a framework where radiologists can categorize a patient’s disease-state by assigning quantitative scores based on the patient’s imaging and clinical information. By having clinicians include a quantitative score along with their written evaluations of their findings, they can provide clear, actionable items for other clinical teams. Structured reporting has found great success in areas such as breast imaging (BI-RADS) and prostate imaging (PI-RADS) by providing objective metrics for tracking patients and assessing treatment plans. For patients with brain tumors, the Brain Tumor Reporting and Data System is a framework growing in popularity in clinical circles. In the following table, the higher the BT-RADS score, the more severe the patient’s disease-state, leading to a more urgent patient management recommendation in the far right column. For more information, please visit https://btrads.com/
Longitudinal Tracking with BT-RADS
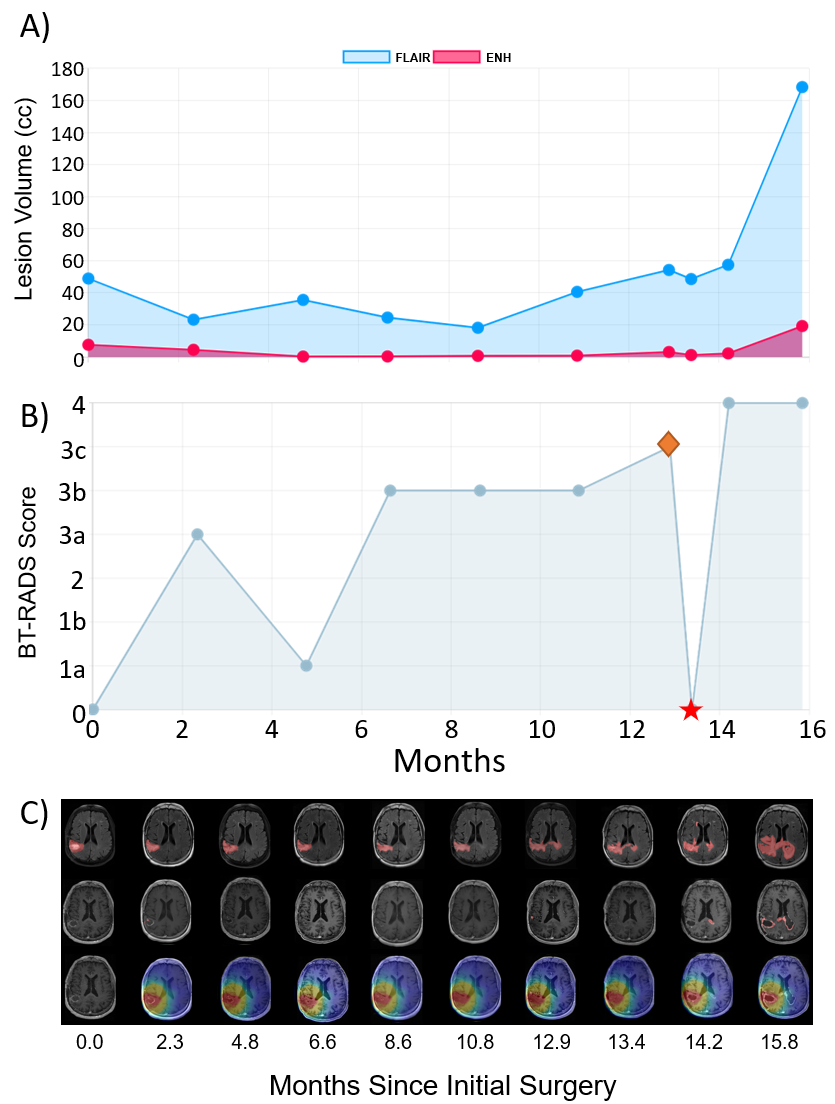
Through our web application BrICS-LIT, we were able to upload de-identified imaging from patients during follow-up visits after completion of radiation therapy. For those patients, lesion volumes were segmented and calculated for both T2/FLAIR MRIs and T1w-Contrast Enhanced MRIs. By calculating those lesion volumes, as well as having other clinical information on hand, clinicians in our team were able to determine more objective BT-RADS scores for each visit. Within BrICS-LIT, we have collected such scores and volume information for patient tracking as well as visualization features to view a timeline of patient disease-state.
Automated BT-RADS Predictions
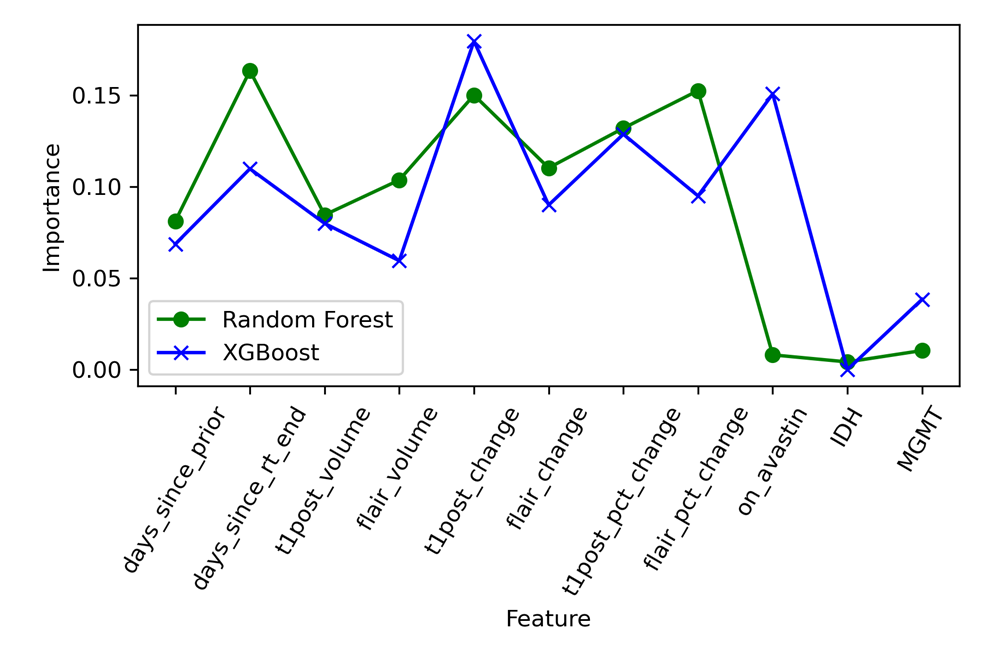
With lesion volumes for every patient visit, along with medication usage and genetic information, we are currently developing decision-tree based machine learning models and deep learning models to predict BT-RADS scores. With such a model, hope to provide suggestive disease-state classifications that can assist clinicians in tracking brain tumor patients as well as assess efficacy of treatments in clinical trial settings in an automated manner. In the following figure, Random Forest and Gradient Boosted decision tree models are compared. In both models, the change in T1w-Contrast enhanced lesions from the previous visit are most important for predicting a patient’s disease-state, which is fairly consistent with clinical decision making. These disease-state classifications will eventually be compared to patient survival.